C4 Model: Architecture Maps That Actually Help
In earlier blog posts, I shared a few C4 diagrams to explain architecture choices. They helped give structure to the messiness of modern systems. But I never really explained the model behind them. So that’s what this post is for. Software architects still struggle with good architecture diagrams. Some draw class diagrams for systems they haven’t even coded. Others scribble some boxes and arrows in Miro and call it a day. And none of it helps new devs understand what they’re joining.
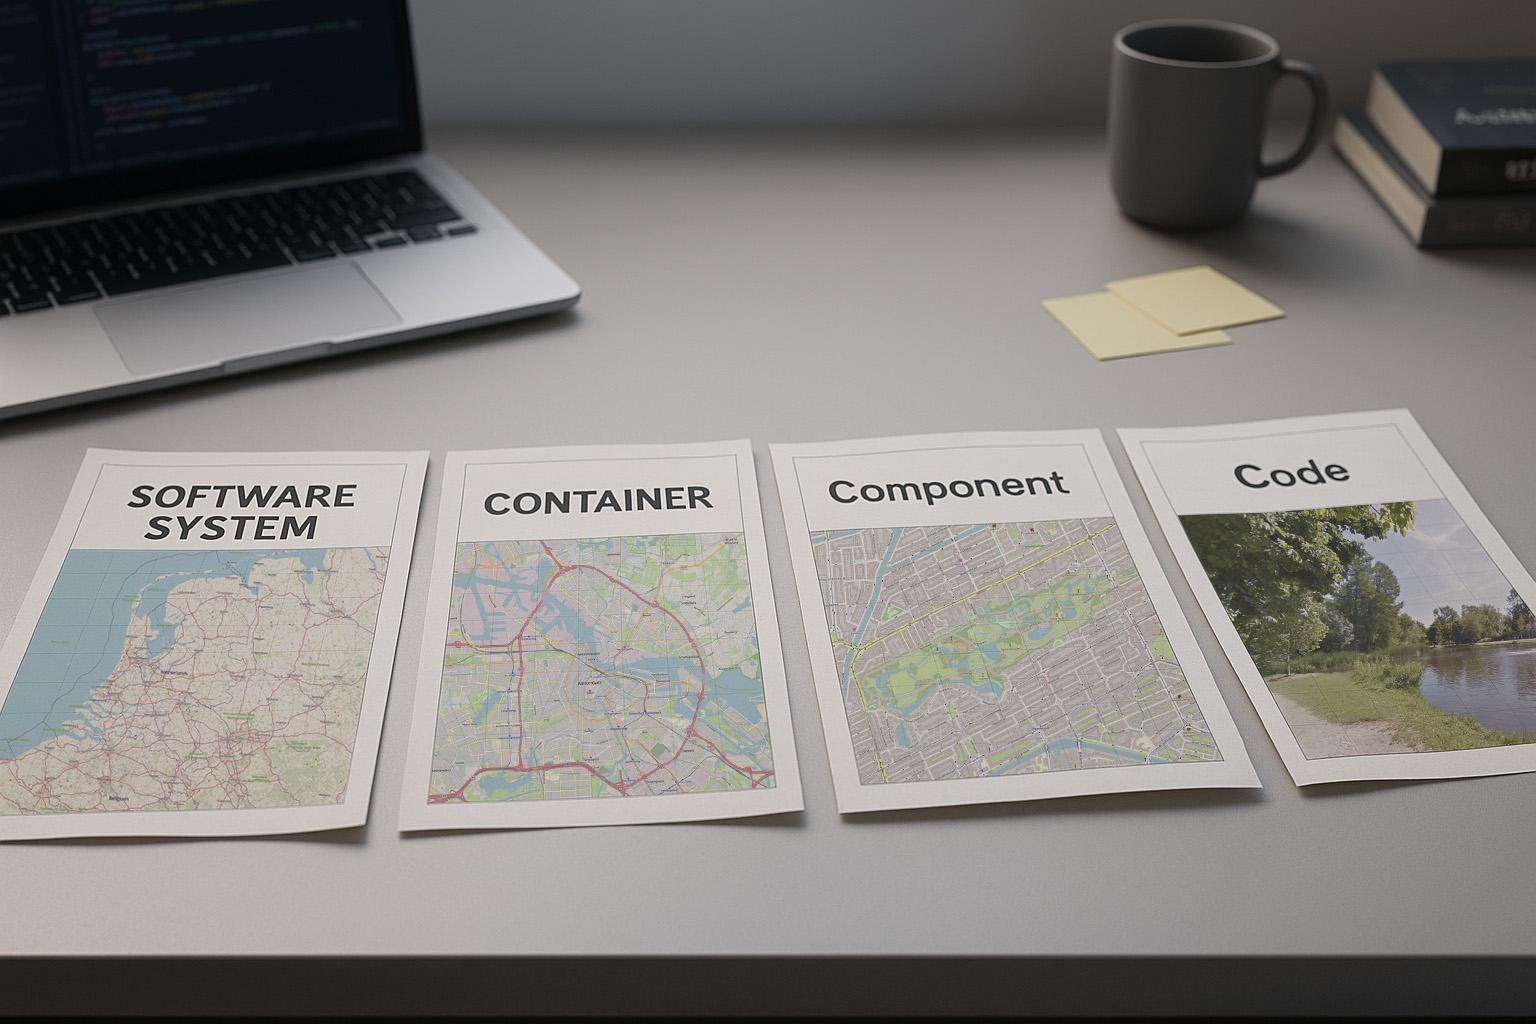
That’s why the C4 model exists. It gives us a clear way to show software architecture, using four levels of abstraction. It’s a thinking tool. Think of C4 like maps for your code. In the same way, you would use something like Google Maps to zoom in and out of an area you are interested in.
Four Abstractions to Rule Them All
C4 stands for Context, Containers, Components, and Code. Each level zooms in more. But not every audience needs every level. That’s the point. It gives you just enough detail depending on who you’re talking to. Too often, we create a single diagram and hope it works for business, devs, and ops alike. It rarely does. The C4 model splits things cleanly so you can explain architecture without oversimplifying or overwhelming.
Imagine you’re helping someone explore a new country, your system. You’d start with a map of the whole country, then zoom into cities, then neighborhoods, then street corners. Same idea here.
1. Software System
Imagine you’re explaining your system to someone who’s never seen it. They don’t need the technical guts, just the big picture. That’s what the context view gives you. It shows your system in its environment. Who uses it, what it connects to, and what role it plays.
Say you’re building a payment platform. A context diagram would show shoppers and merchants as users. It would show connections to a bank API and a fraud detection service. And it would place your system, labeled "Payment Platform," right in the center. This is what you’d show to a product owner, a business stakeholder, or a new developer on day one. It answers one simple question: what is this thing, and who does it talk to?
2. Container
Now that you know what your system is and who it talks to, the next question is: how is it built? That’s what the container view explains. Think of it like the city map inside your country. It shows the big deployable pieces that make up the system. Take the payment platform again. It might have a public API for handling client requests. Behind that, there’s a fraud engine doing checks in real time. And all of it talks to a PostgreSQL database where transactions get stored. Each of these is a container. Each runs on its own. Each has a clear job.
This view helps developers, DevOps, and architects understand the big moving parts. It answers: how does this thing run, and what are the responsibilities of each piece?
3. Component
Once you know the containers, it’s time to zoom in again. The component view lets you peek inside one container to see how it works. Think of it like looking inside a building to see the rooms and how they’re used. Say you open up the public API container. Inside, you’ll likely find an authentication component to verify users. There’s probably a transaction handling piece that processes payments. And maybe a reporting component to summarize activity. Each of these does a specific job inside that container.
This view is for developers and tech leads who need to understand how the internals are structured. It answers: what’s in this box, and how is the work divided?
4. Code View
When you’ve zoomed through context, containers, and components, there’s one level left. Code. This is where you open the last door and see the exact implementation. It’s where diagrams show class structures, module layouts, or key pieces of logic that are too complex to explain in words. Imagine a developer walking into the reporting component you diagrammed earlier. If the logic is dense or layered, a quick class diagram can help them find their footing faster. But you don’t always need this view. If the code is already clear and readable, showing it again in a diagram just adds noise.
Use this level when it adds value. Not every system needs it. But when a senior dev or reviewer needs a quick orientation in a tricky module, this can be the map that saves hours.
Boxes With a Purpose
Most architecture diagrams don’t work well because they skip layers or mix abstractions. One minute you’re showing HTTP calls, the next you’re drawing class diagrams, all on the same slide. It’s confusing, inconsistent, and useless. The C4 model fixes this with clear layers. It forces you to think. It separates the big picture from the low-level plumbing. You get consistency. You get traceability. You get shared understanding.
It’s the difference between "the boxes we drew once in a whiteboard tool" and a living architecture that actually helps people make decisions. It helps to have the right tools.
| Tool | Type | Pros |
|---|---|---|
| Structurizr | Model-based | Code and diagrams stay in sync, versionable |
| PlantUML | Text-based | Lightweight, fits right into your documentation |
| Icepanel | Visual modeling | Great for teams, drag-and-drop with structure |
| Lucidchart or Miro | Visual drawing | Easy collaboration, but less architectural rigor |
I mostly work with Structurizr. It fits how I think. I can model architecture in code, keep it under version control, and generate clean views without dragging boxes around. It’s fast, consistent, and works well across abstraction levels.
If you’re more visual or working closely with non-developers, Icepanel is a solid pick. It adds structure to diagramming without forcing you to write DSL. Great for shared understanding in workshops or architecture reviews. Pick the tool that matches how your team works. Just don’t rely on screenshots of sticky notes.
Fewer Arrows, More Answers
The C4 model helps you bring clarity to your system diagrams. It makes your architecture easier to understand without oversimplifying. You get a shared language across roles, better onboarding, and cleaner design discussions. If you’ve ever had to explain a system and found yourself hand-waving over a vague diagram, it’s probably time to try something better.
Start small. Pick one system. Map the context. Break it into containers. Zoom into one and sketch the components. You don’t have to model everything, just enough to make things clear. Use tools like Structurizr if you want versionable, code-backed diagrams. Or try Icepanel for more visual, team-friendly modeling. Either way, the C4 model gives you a structure that scales.
Your architecture deserves better than a whiteboard photo in Confluence. Try the C4 model and start mapping what actually matters.
Share this article
Enjoyed this article?
Subscribe to get more insights delivered to your inbox monthly
Subscribe to Newsletter